See the impact of every
license you fund.
Pebble gives your service users structured support while they wait for ADHD assessment. The Service Dashboard gives you the evidence to prove it's working.
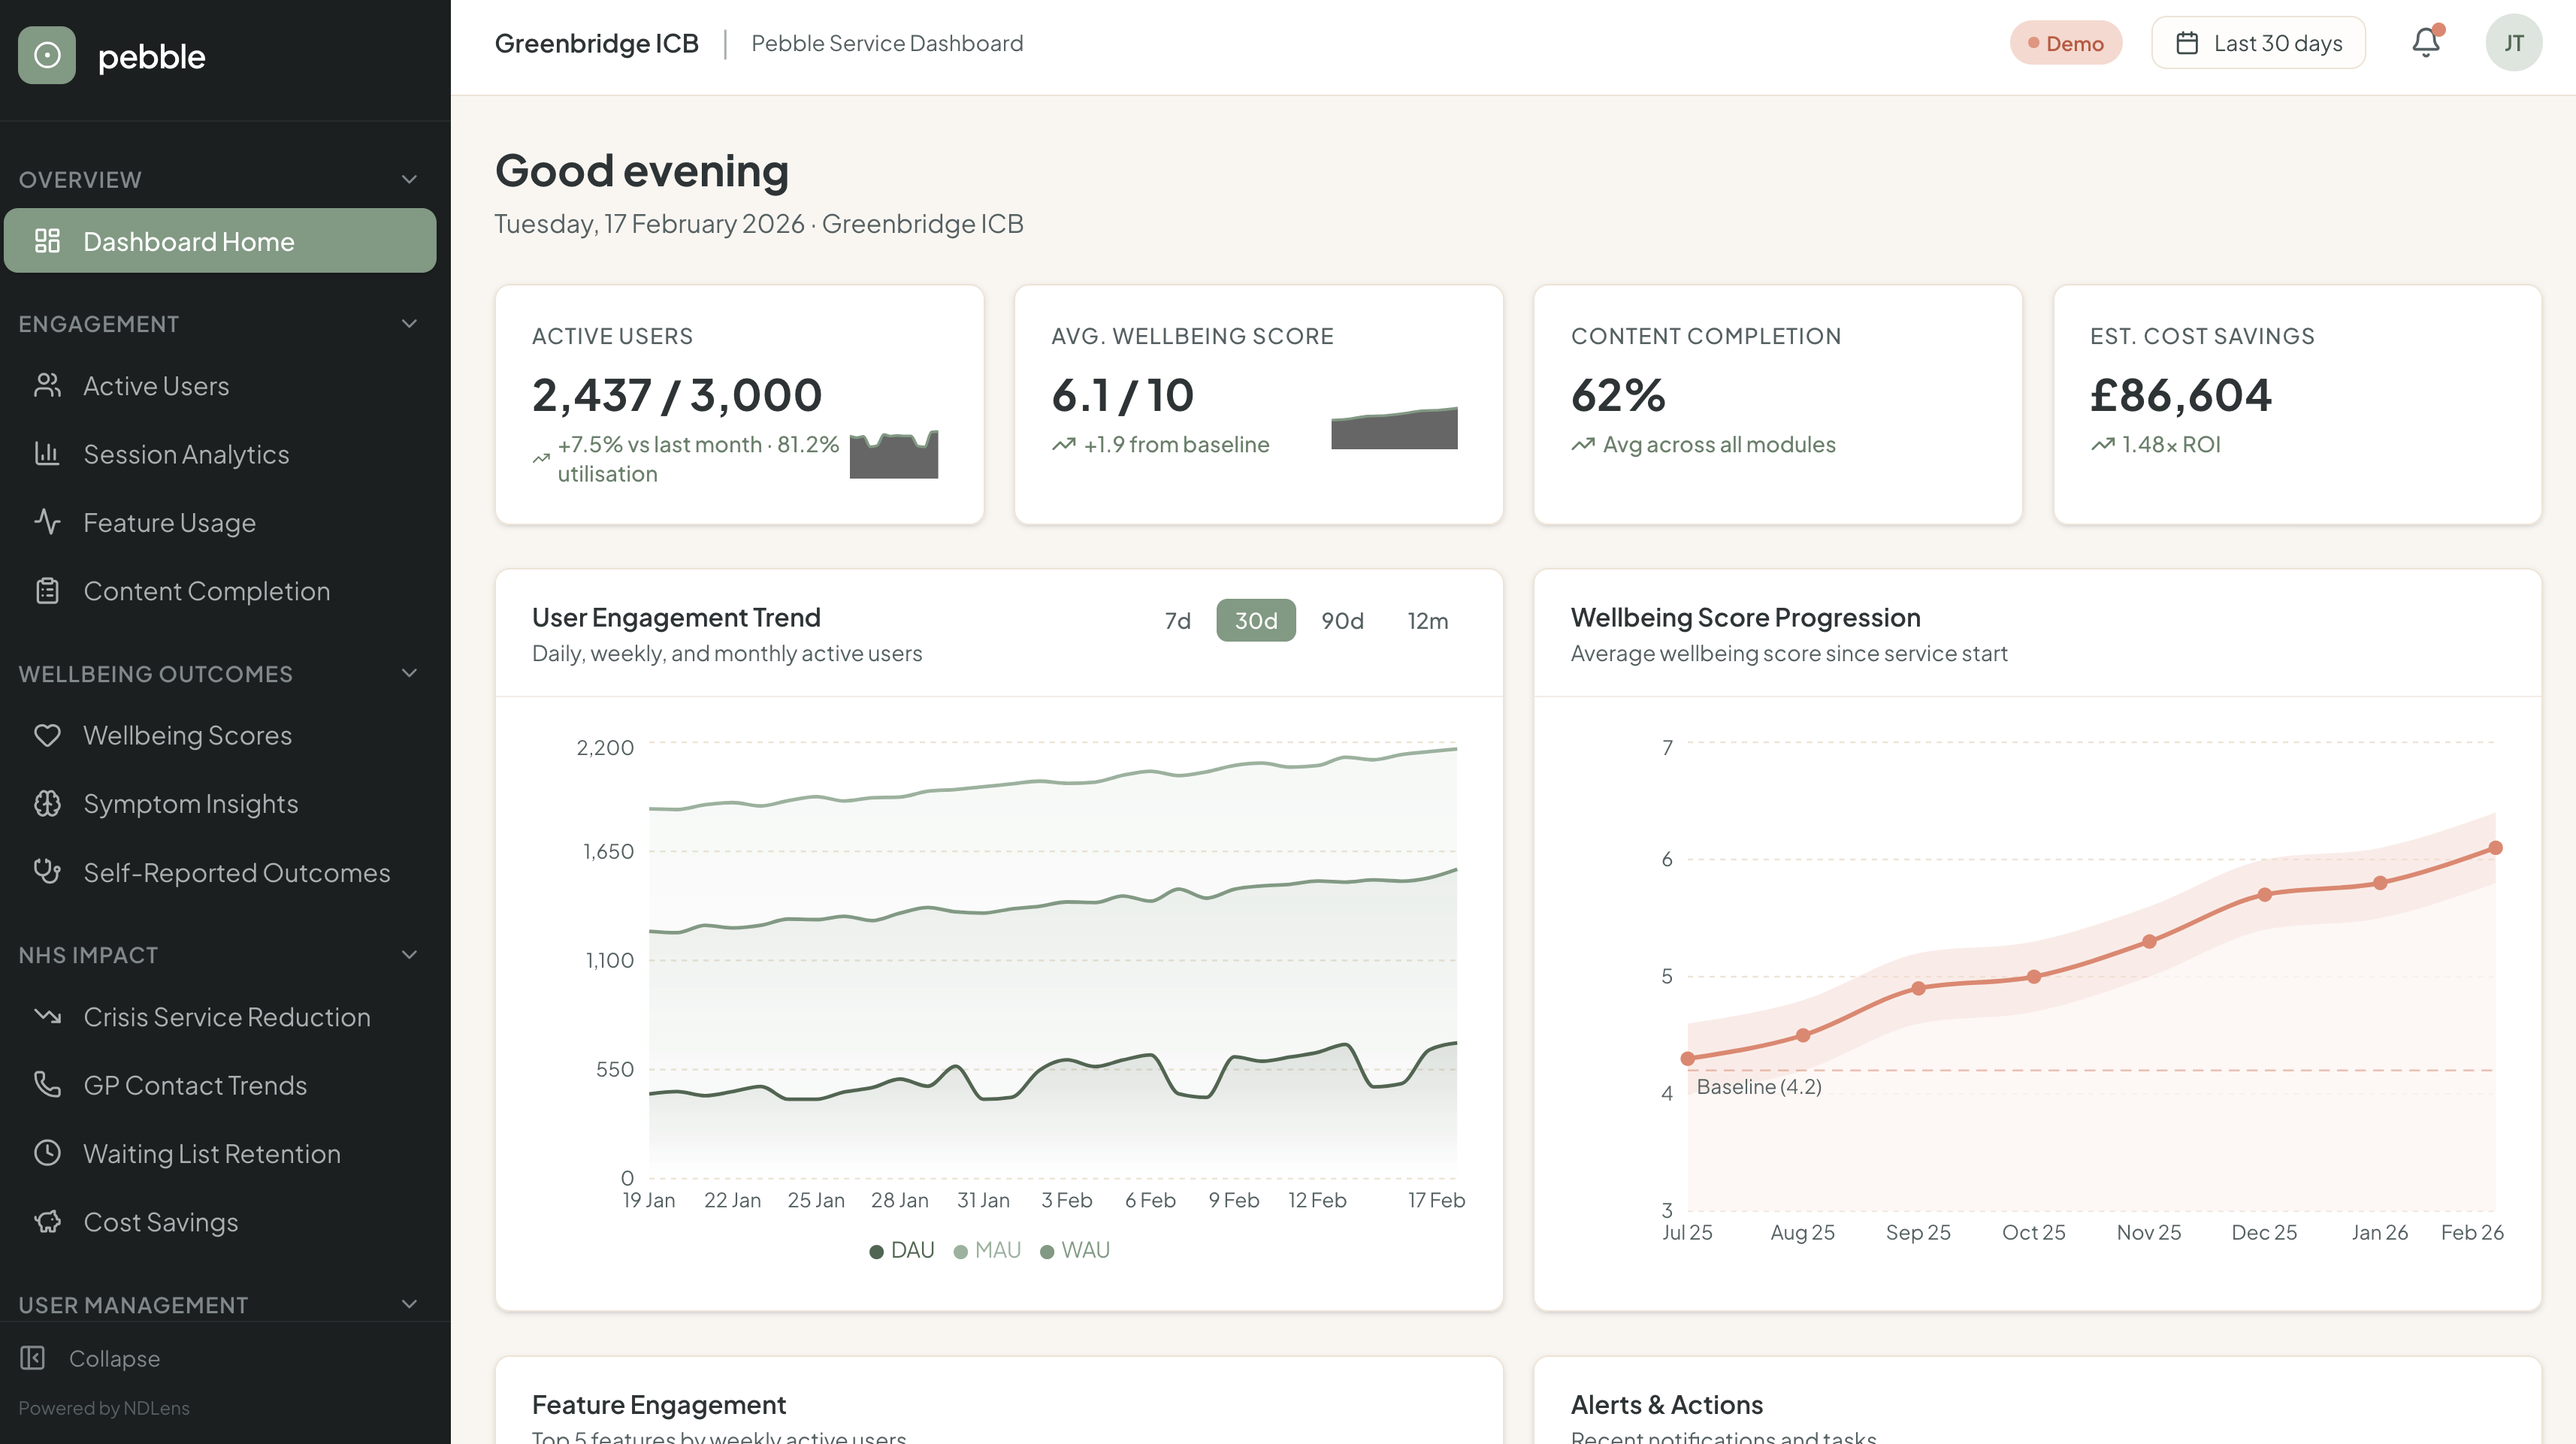
Real-time engagement you can actually report on
You need to know that the tools you commission are being used. The Pebble Service Dashboard shows you exactly how your licensed users engage — daily, weekly, and monthly active user trends, session durations, and which features drive the most consistent return visits. No more wondering whether that digital intervention is gathering dust.
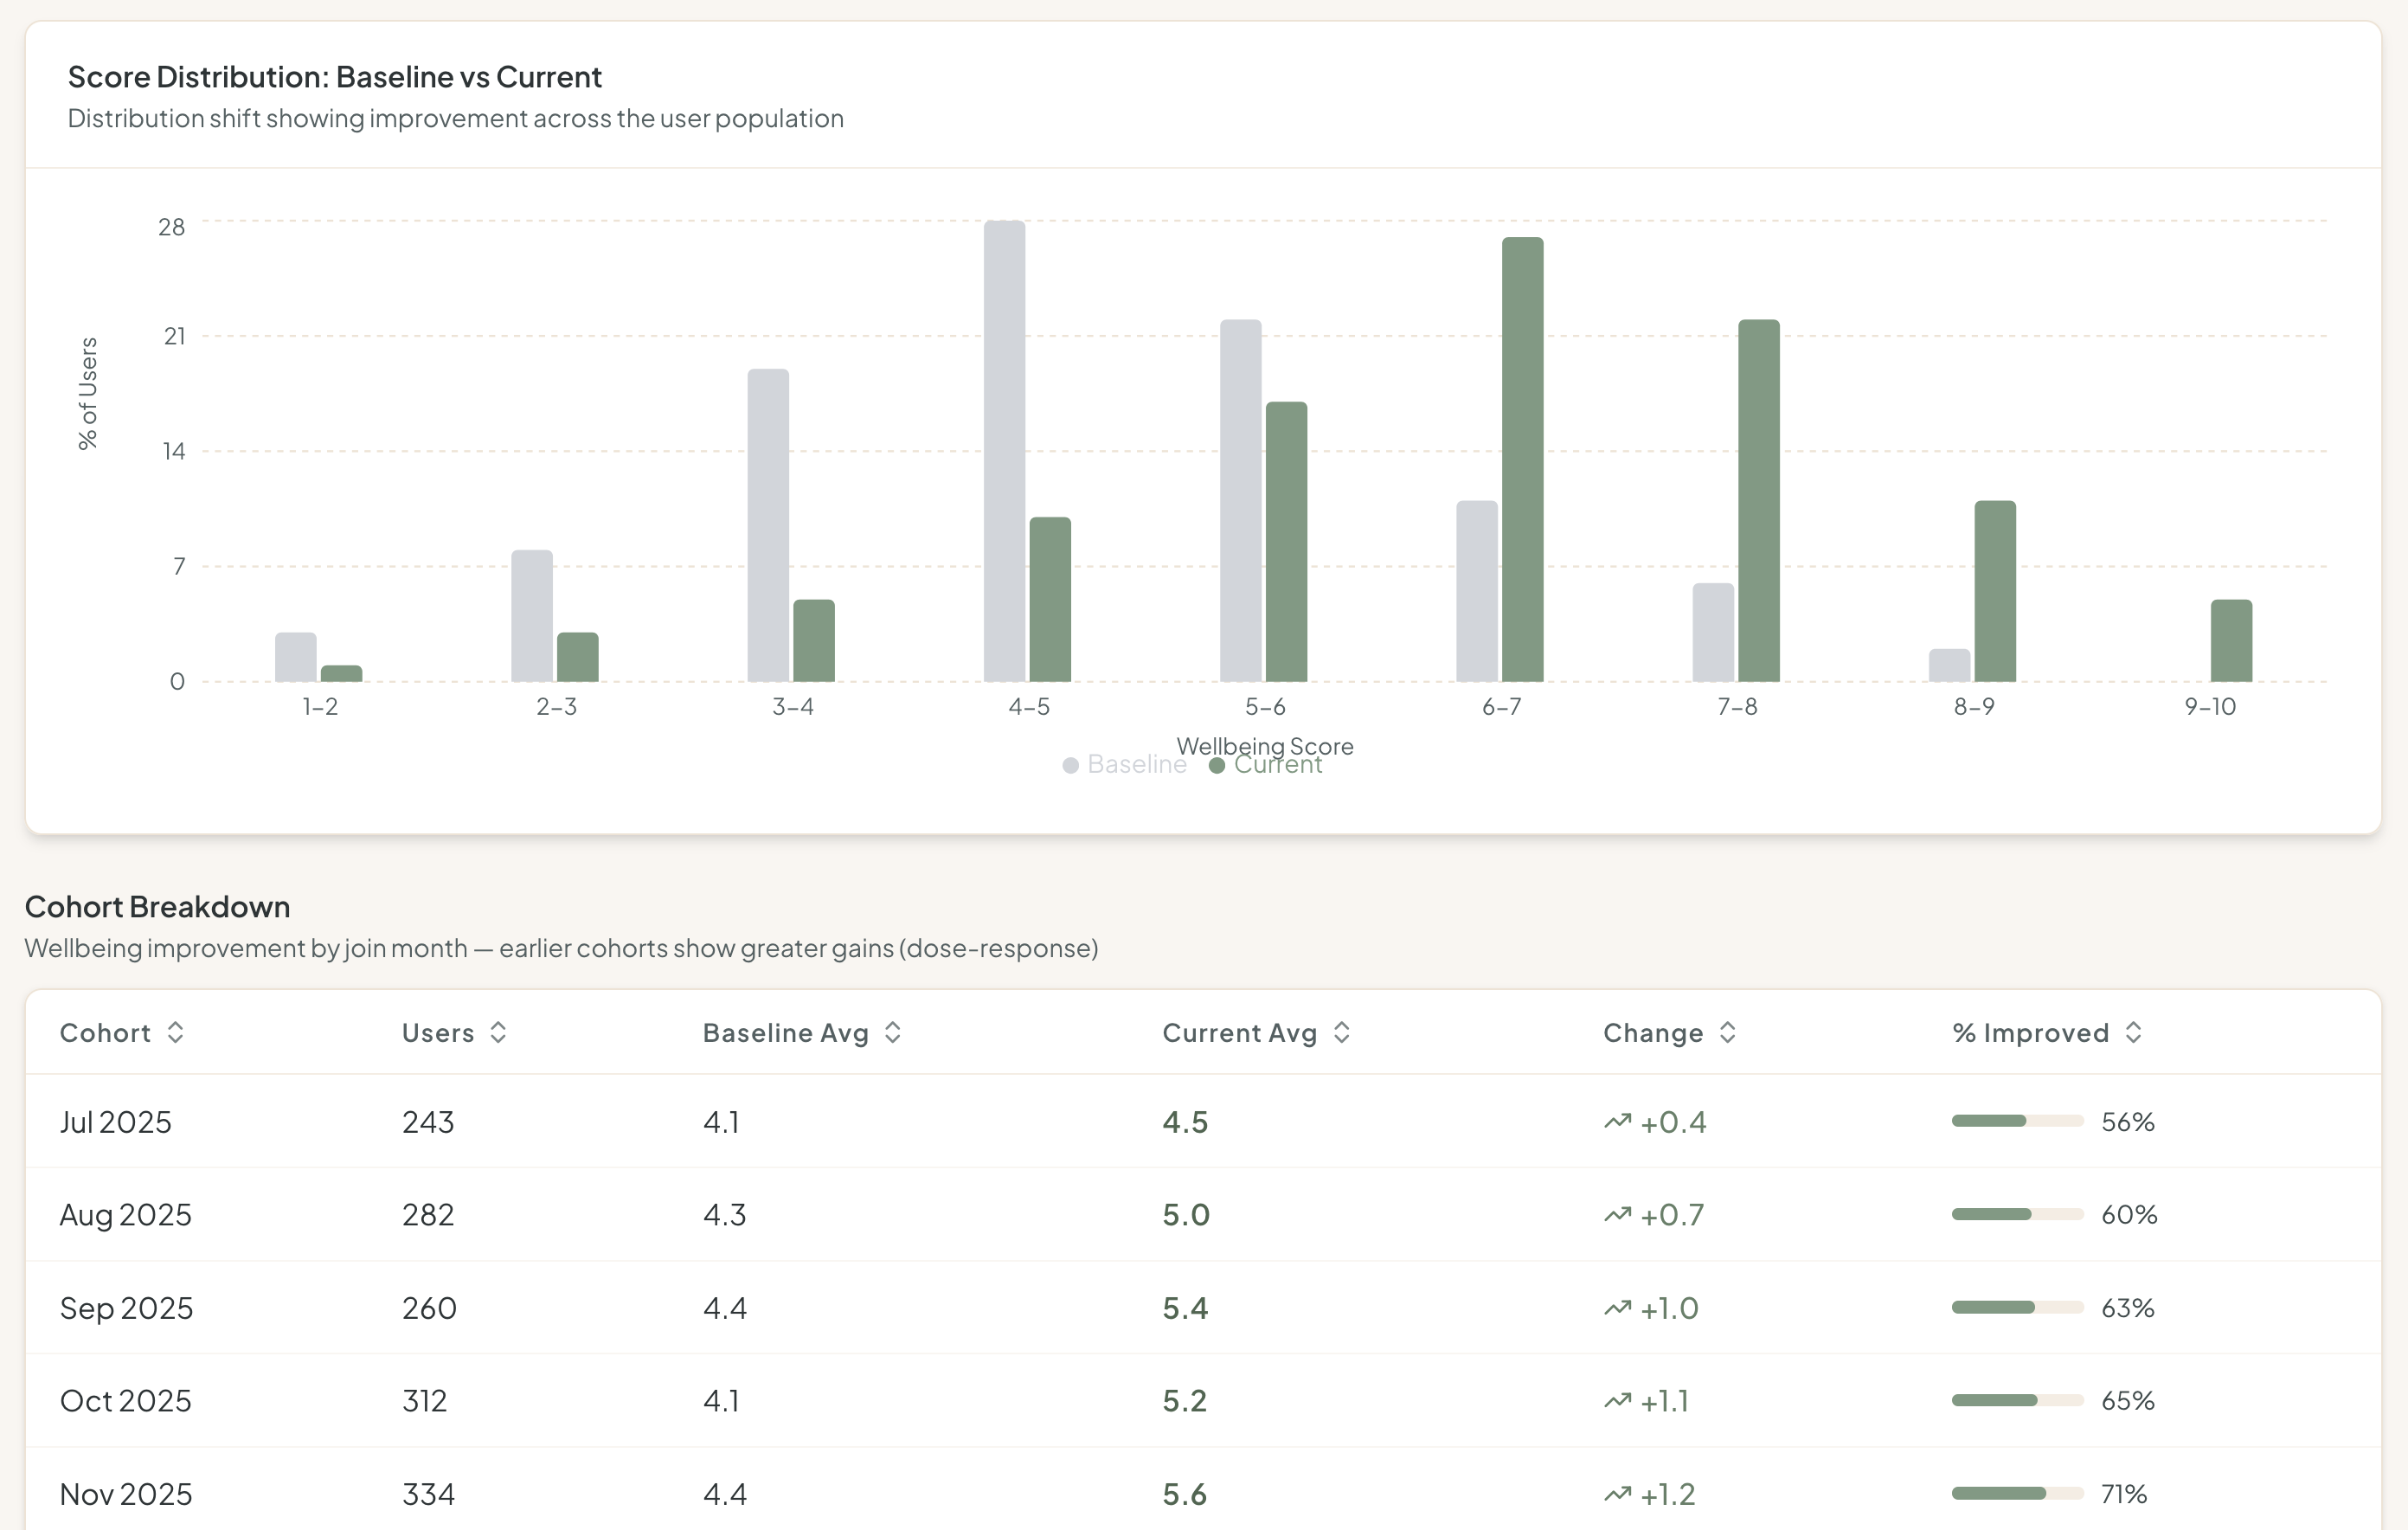
Wellbeing outcomes that stand up to scrutiny
Commissioners need more than anecdotal feedback. Pebble tracks validated wellbeing scores from baseline through every month of use, giving you a clear, quantified improvement trajectory across your entire cohort. You can see score distributions shift over time, break results down by cohort, and identify the dose-response relationship between content completion and wellbeing gains.
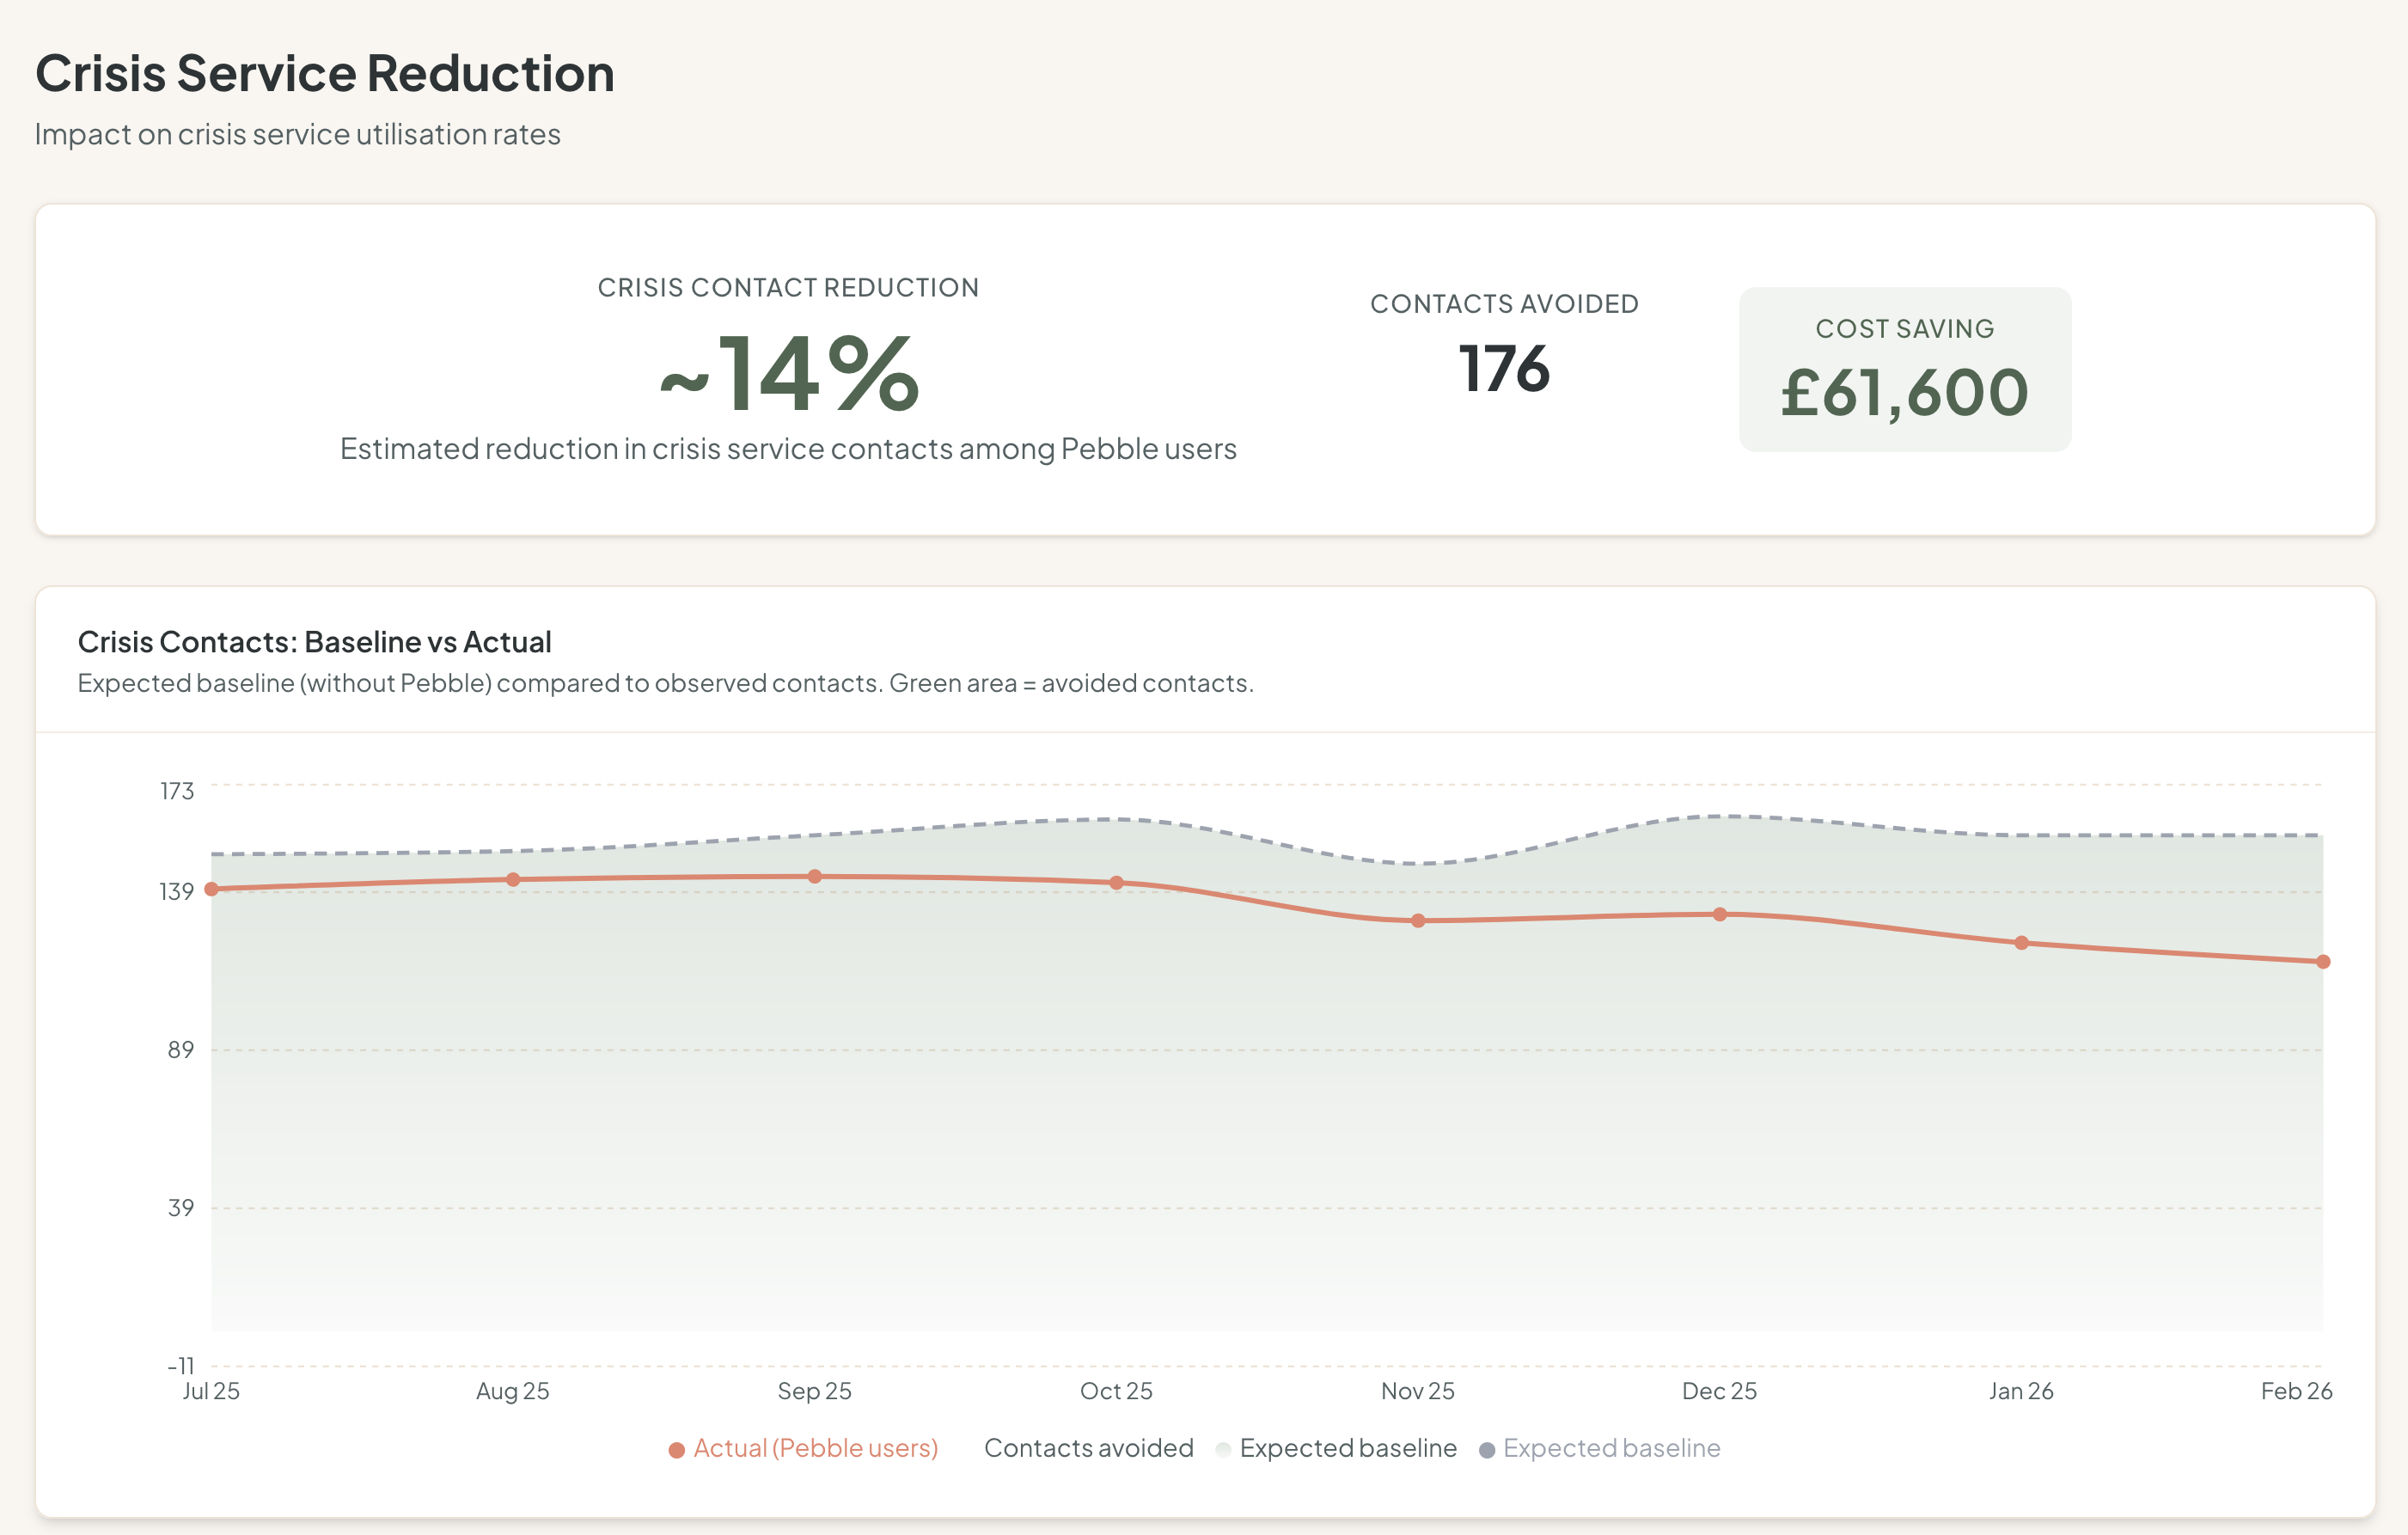
Evidence of reduced pressure on crisis and GP services
The strongest business case for preventive digital support is downstream cost avoidance. The dashboard tracks estimated crisis service contact reduction and ADHD/anxiety-related GP visit trends among your Pebble users against published baselines. Every avoided crisis contact and unnecessary GP appointment is quantified and costed, giving you figures you can take to governance boards.
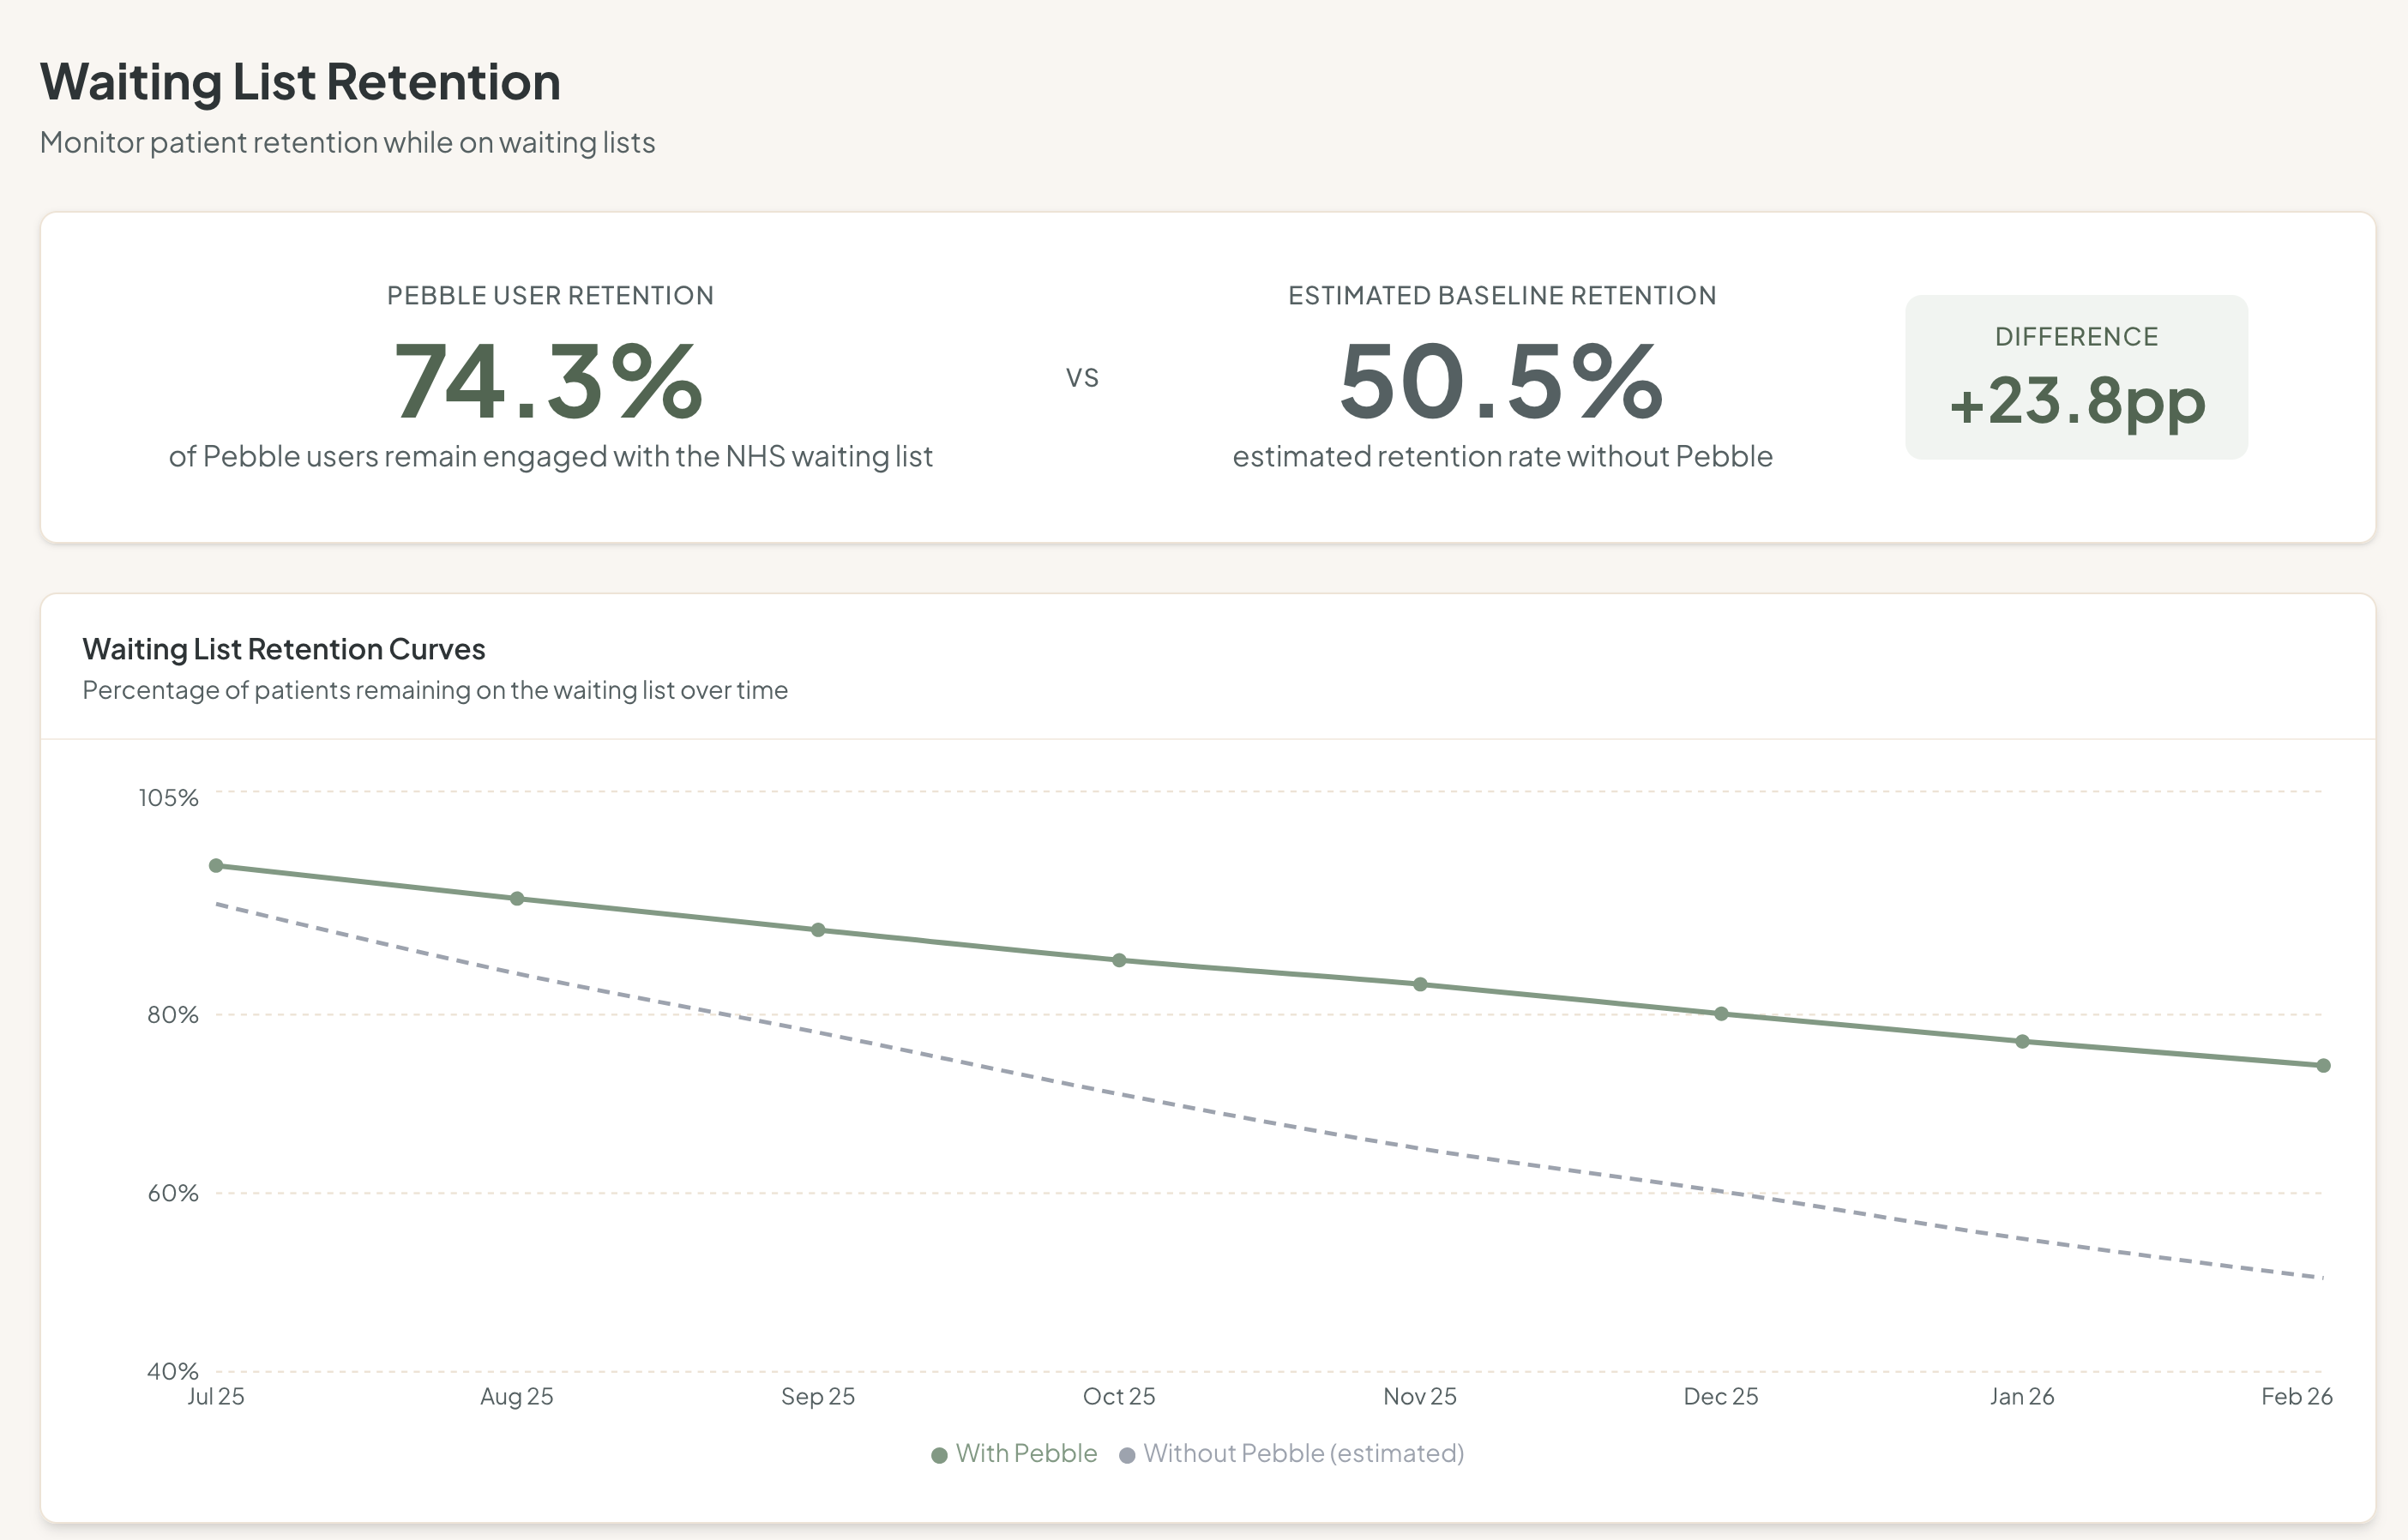
Keep people engaged with the waiting list, not lost to it
When patients disengage from multi-year waiting lists, they often re-present through emergency pathways at far greater cost. Pebble keeps your service users connected, informed, and supported throughout the wait. The dashboard shows you retention curves for Pebble users against estimated baselines, and flags individuals at risk of disengaging so your team can act early.
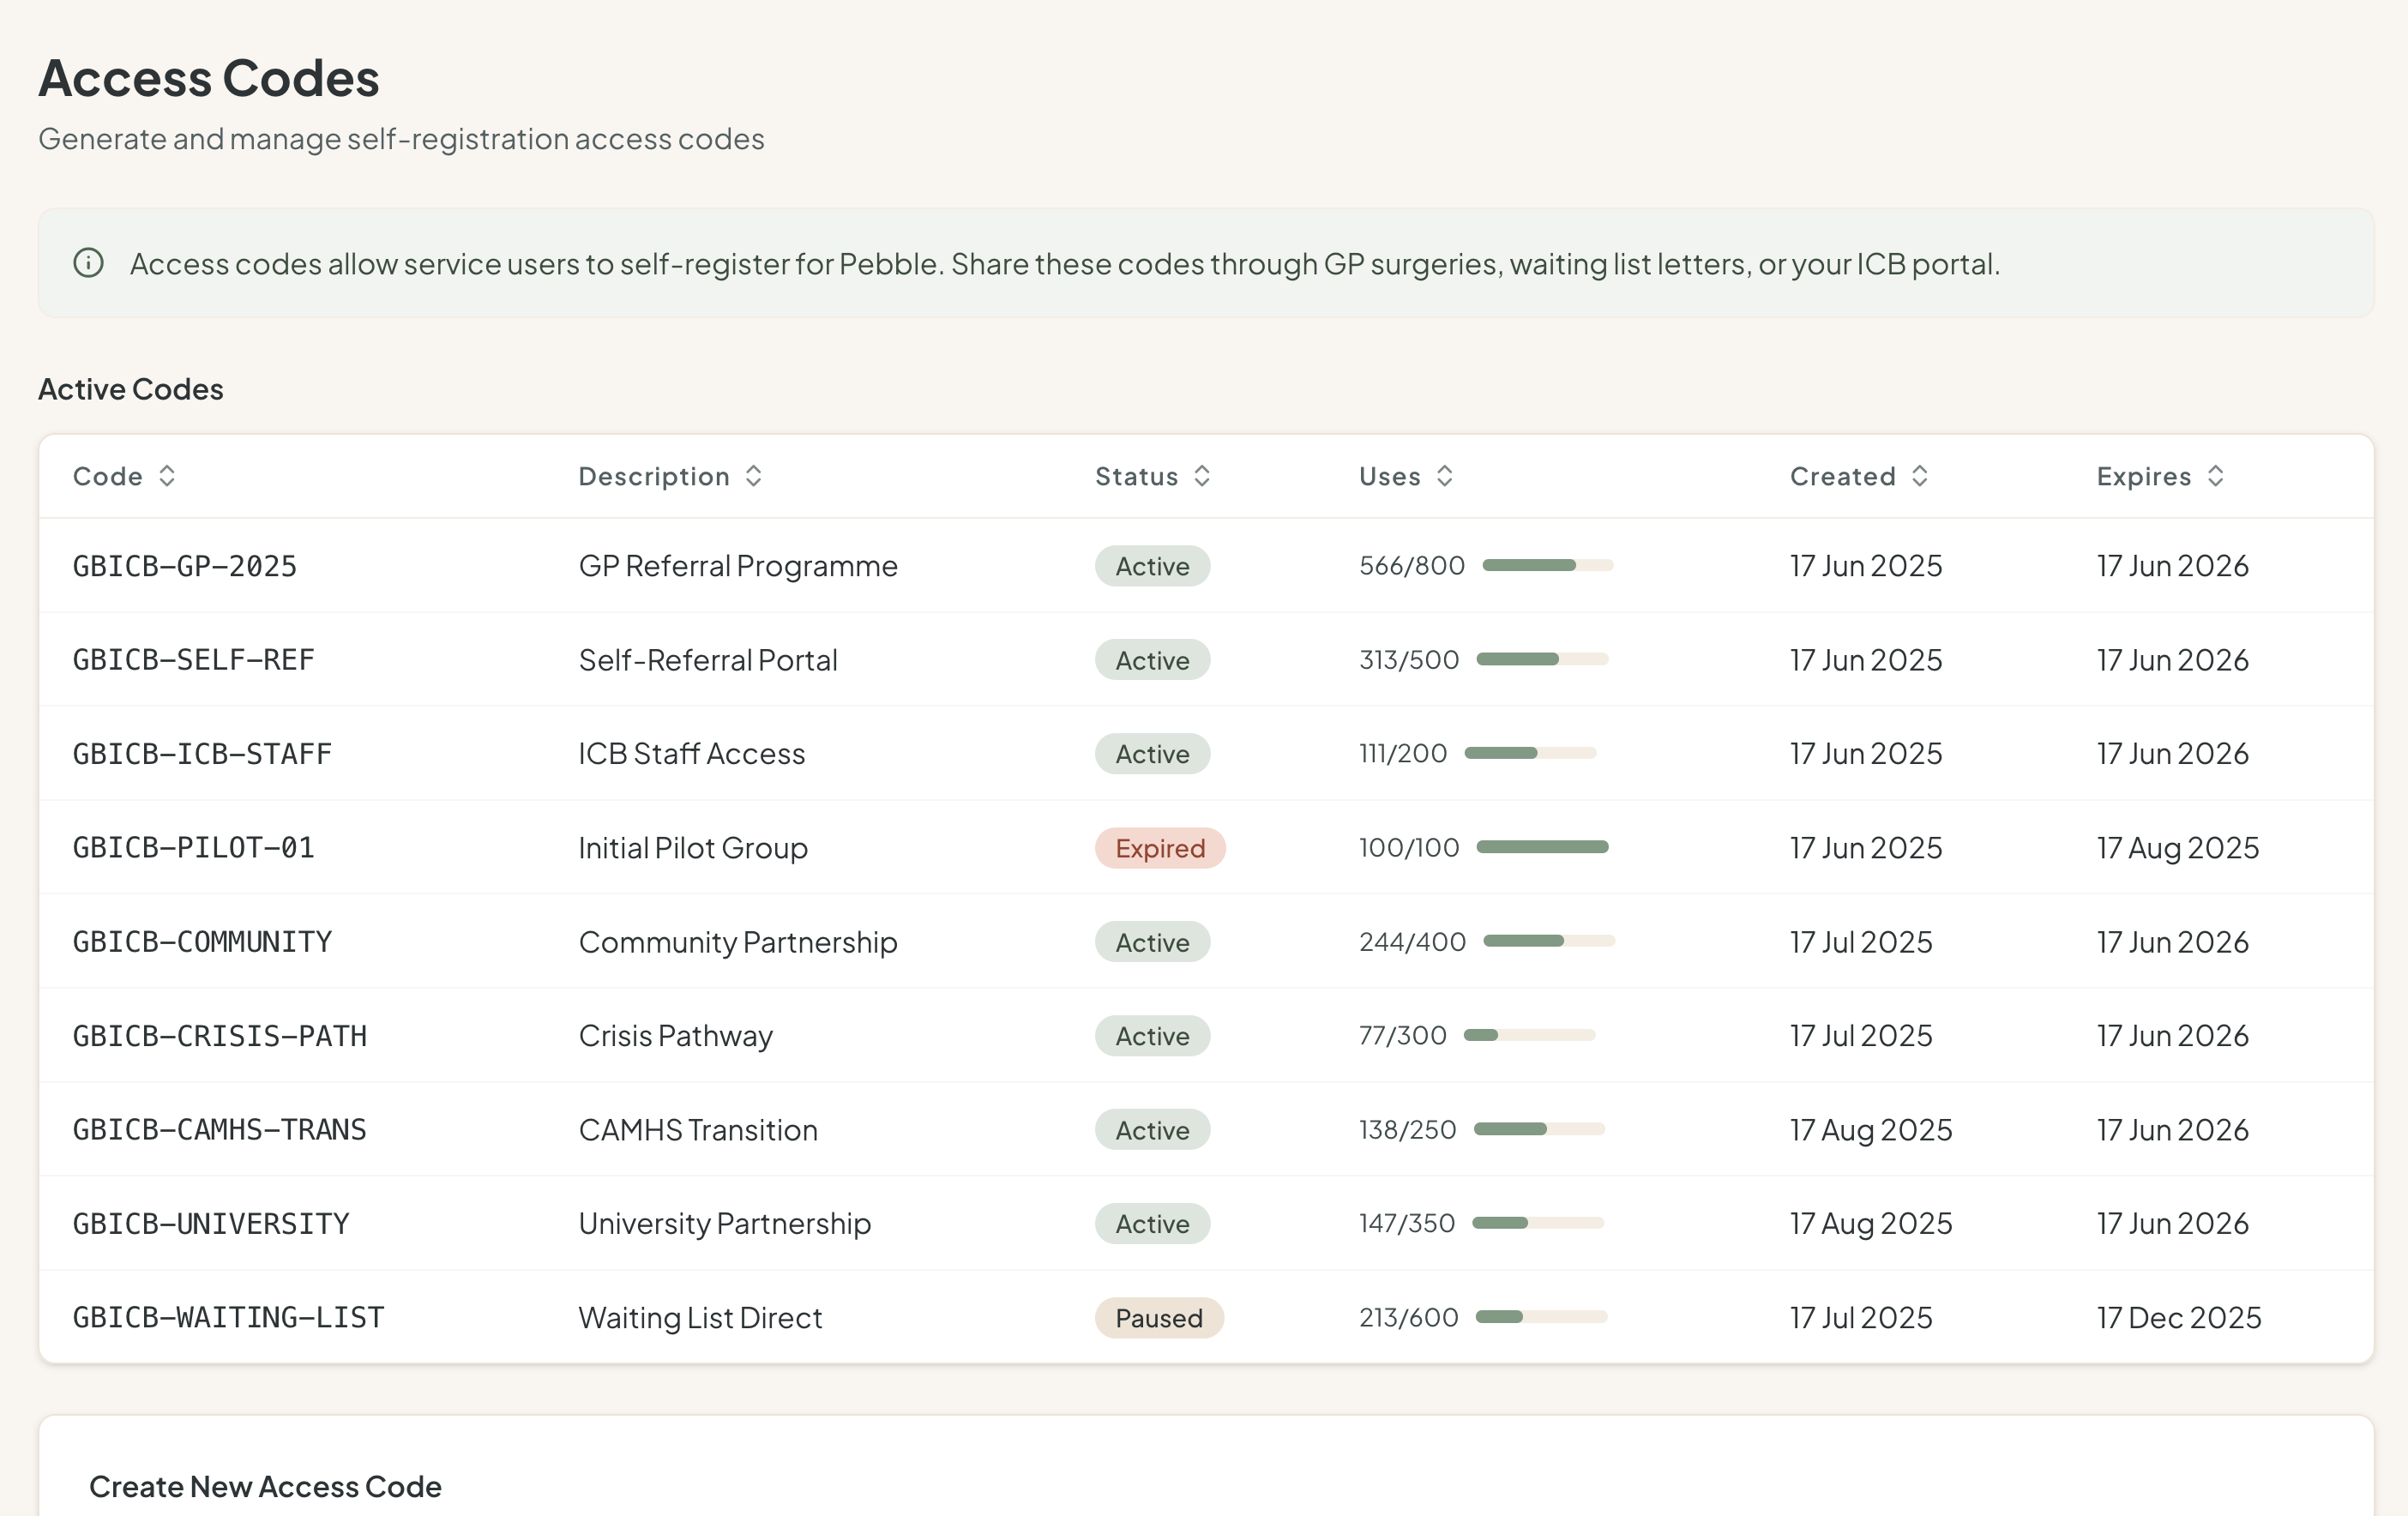
Manage users and licenses without the admin headache
Invite users individually or in bulk, distribute access codes through GP surgeries and waiting list letters, and track license utilisation across your service. The dashboard gives your admin team a single place to see who's active, who needs a nudge, and how your allocation is being used — no spreadsheets, no guesswork.
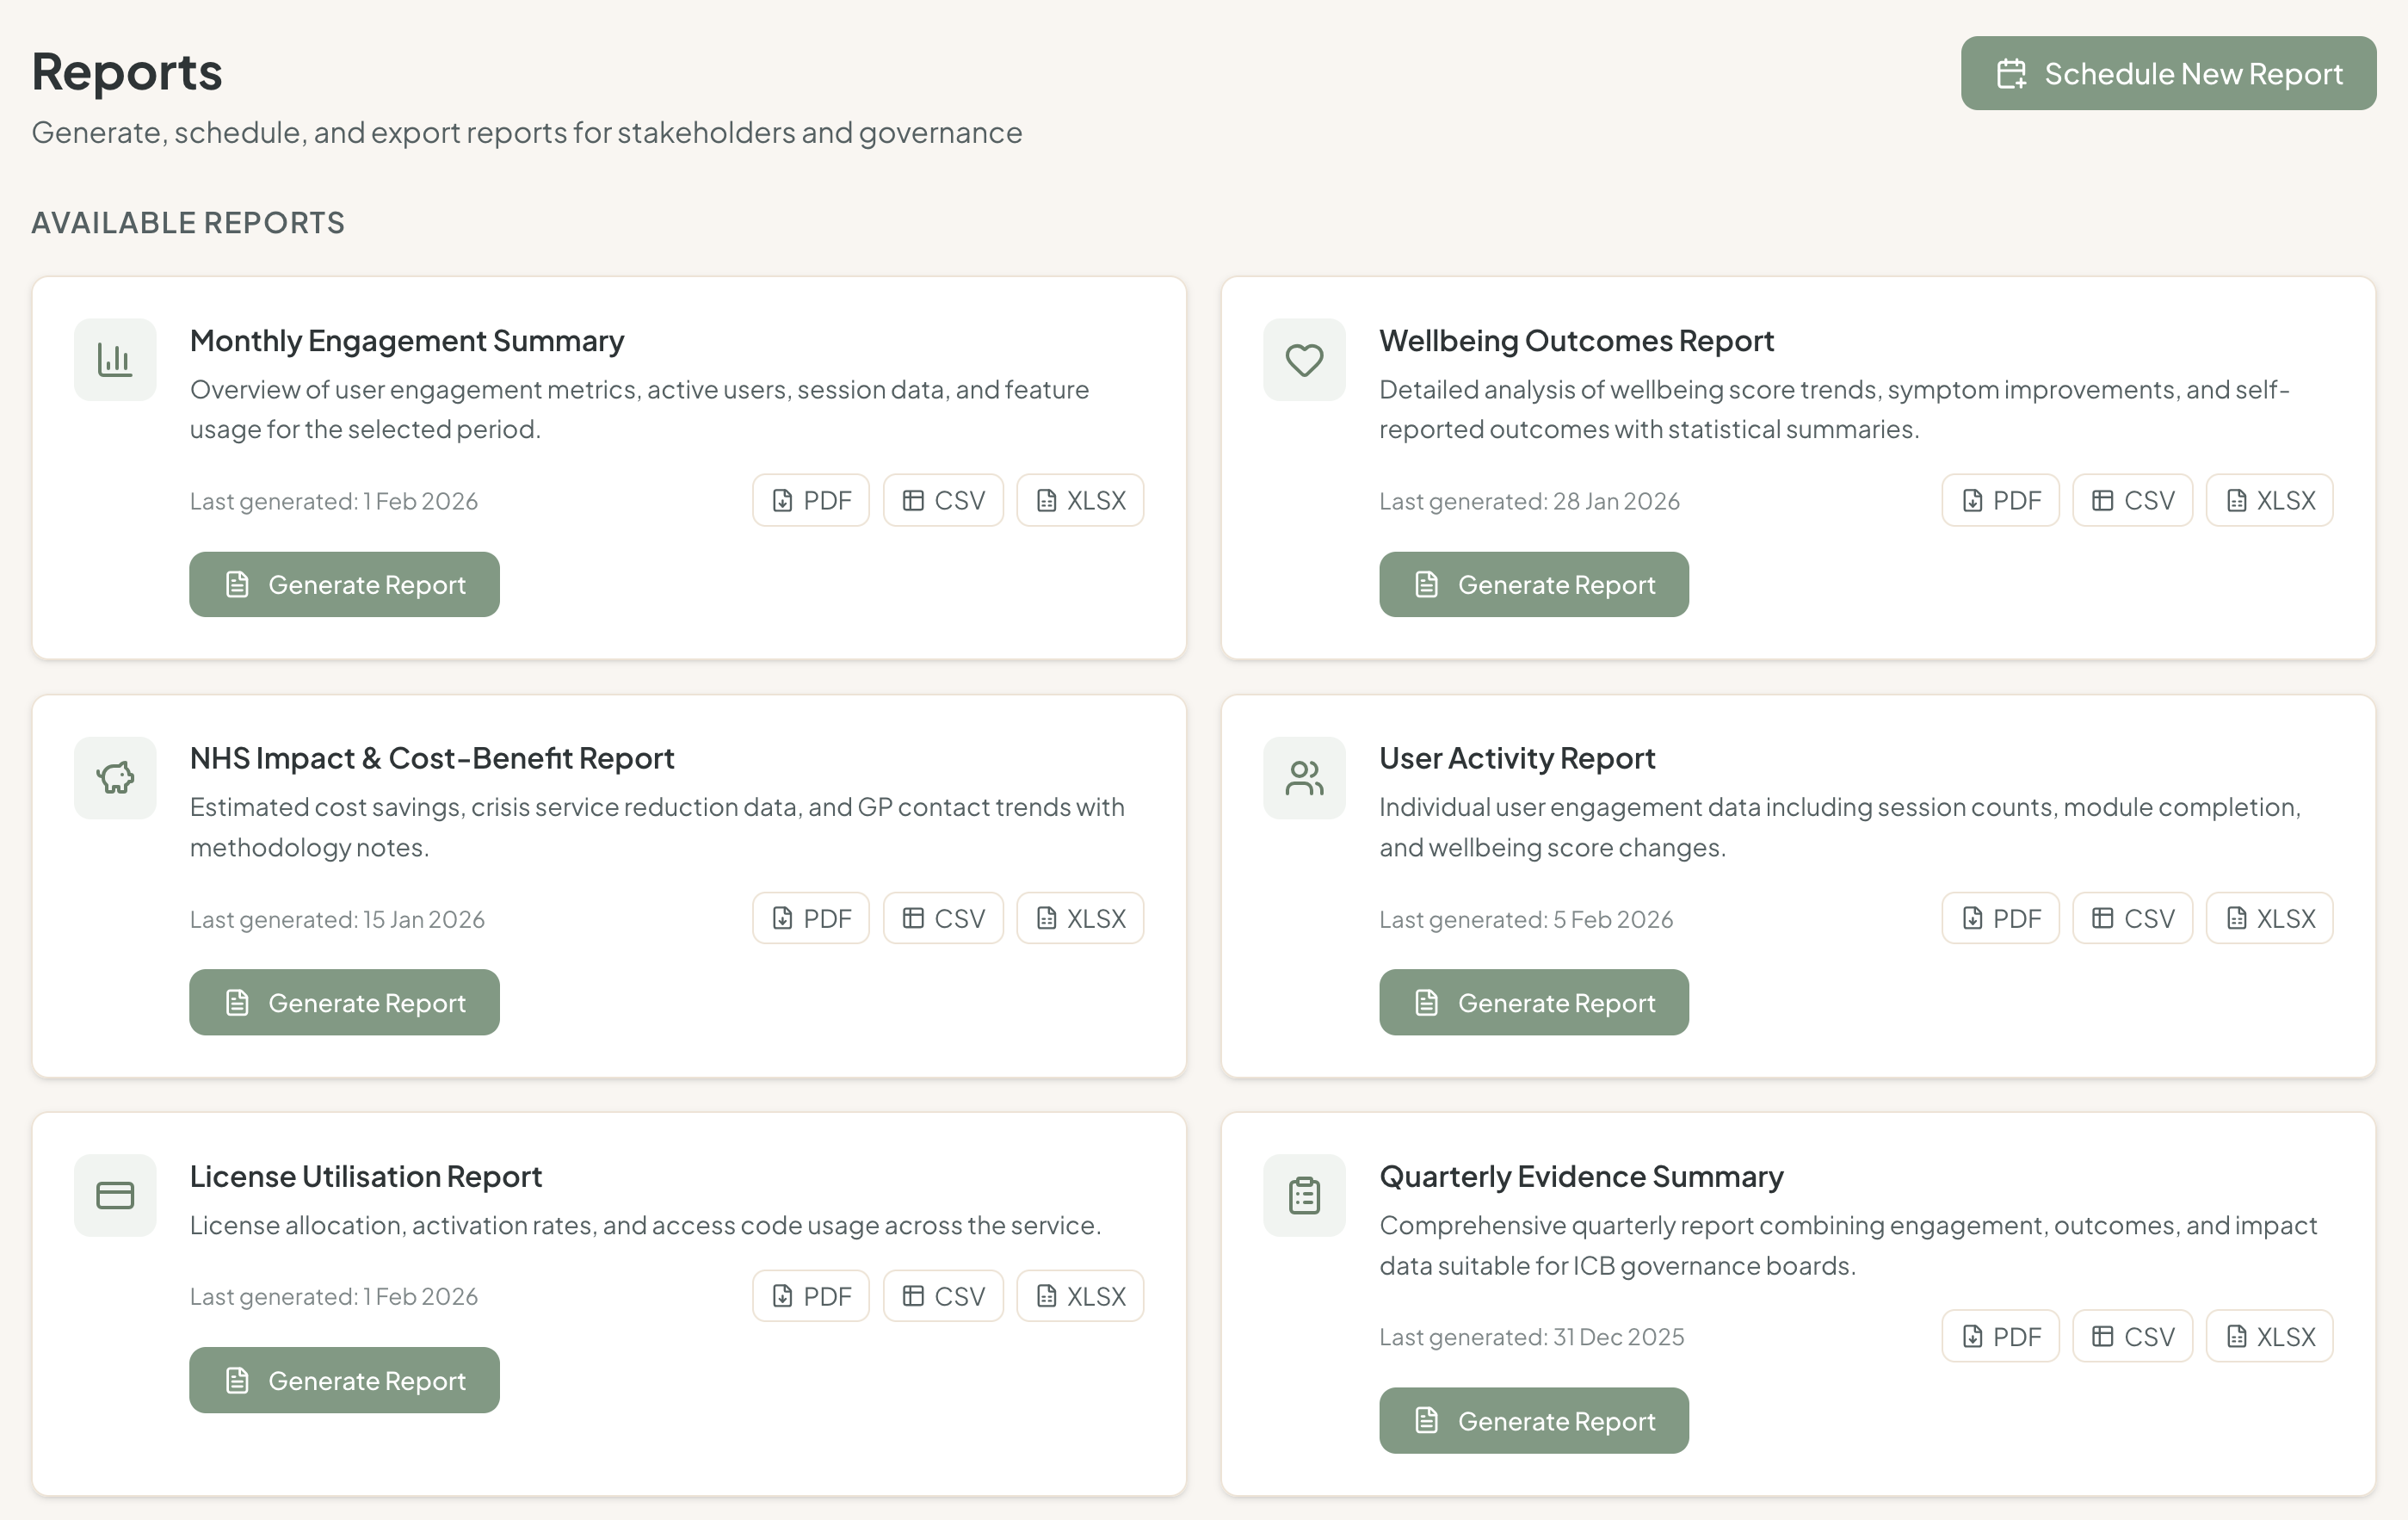
Reports ready for governance, whenever you need them
Generate monthly engagement summaries, quarterly evidence reports, and cost-benefit analyses on demand or on a schedule. Every report is designed for the audience that matters — formatted for ICB boards, clinical leads, and commissioning reviews. Export as PDF or CSV and share with confidence.
Support your waiting list.
Evidence the impact.
Justify the investment.
Over 549,000 adults in England are waiting for an ADHD assessment with no structured support. Pebble fills that gap with clinician-created, ADHD-friendly content and daily engagement tools. The Service Dashboard ensures you never have to take that on faith.
Get in Touch